Operational Reporting for Vacation Rentals: 2026 Guide
Discover what operational reporting for vacation rentals is and how it can boost your business efficiency, revenue, and guest satisfaction in 2026.

Operational Reporting for Vacation Rentals: 2026 Guide
Operational reporting for vacation rentals is the practice of measuring and analyzing key metrics like occupancy, revenue, cleaning turnaround, guest satisfaction, and profitability to support efficient property management and maximize business results. Property managers who treat this as a core discipline rather than a monthly chore consistently outperform those who rely on gut instinct. Platforms like Key Data and Roadrunner Escapes have built entire product lines around this insight. When you consolidate data from your property management system (PMS), Airbnb, Vrbo, and your finance tools into a single view, you stop reacting to problems and start preventing them.
What is operational reporting for vacation rentals?
Operational reporting in the vacation rental context is the structured process of collecting, organizing, and reviewing performance data across every layer of your business. The industry term you will encounter in PMS documentation and analytics platforms is performance reporting, though “operational reporting” is the working phrase most managers use day to day. Both refer to the same discipline: turning raw numbers into decisions.
Operational reporting focuses on supporting efficiency by tracking process metrics like cleaning turnaround and exception alerts. That definition matters because it separates operational reporting from financial reporting. Financial reports tell you what happened to your money. Operational reports tell you why it happened and what to do next. A property with a 90% occupancy rate looks healthy on a financial statement. An operational report might reveal that cleaning turnaround is averaging four hours, that three maintenance tickets have been open for two weeks, and that guest review scores have dropped half a point in the last 30 days. Those signals demand action before they become revenue problems.
The data sources that feed operational reports typically include your PMS, channel managers connected to Airbnb and Vrbo, cleaning and maintenance apps, and guest communication tools. When these sources are siloed, you spend hours assembling spreadsheets. When they are connected through a dashboard, you spend those hours managing your business instead.

What KPIs should vacation rental managers track?
Vacation rental managers should track about 5 to 10 critical metrics spanning revenue, guest experience, operational efficiency, and profitability. Tracking fewer metrics deeply beats tracking 30 metrics superficially. Here is how to organize them:
Revenue metrics
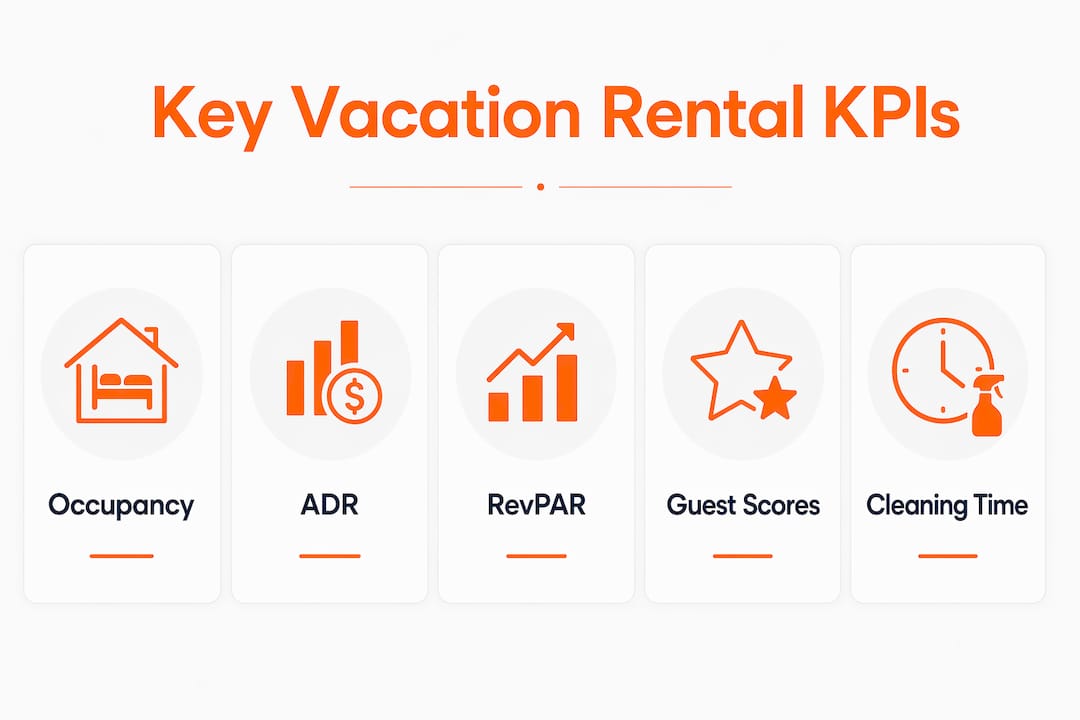
- Occupancy rate: The percentage of available nights booked. High occupancy with low ADR signals underpricing.
- Average Daily Rate (ADR): Revenue per booked night. Tracks pricing power across seasons.
- Revenue Per Available Room (RevPAR): Occupancy multiplied by ADR. The single most useful revenue summary metric.
Guest experience metrics
- Review score average: Aggregated across Airbnb, Vrbo, and Google. A drop of 0.2 points on a 5-point scale measurably reduces booking conversion.
- Repeat guest rate: The share of bookings from returning guests. High repeat rates lower your customer acquisition cost.
Operational efficiency metrics
- Cleaning turnaround time: Hours between checkout and check-in readiness. Delays here cause booking conflicts and negative reviews.
- Maintenance resolution time: Days from ticket creation to resolution. Unresolved tickets are the leading cause of mid-stay complaints.
Profitability metrics
- Net Operating Income (NOI): Revenue minus all operating expenses. The true measure of property health.
- Cost per booking: Total operating cost divided by number of bookings. Tracks efficiency as you scale.
Pro Tip: Set a weekly 15-minute dashboard review on your calendar. Reviewing KPIs weekly catches trends before they become crises. Monthly reviews are too slow for a business where a single bad weekend can skew your quarter.
The goal is not to memorize these numbers. The goal is to build a reporting rhythm where deviations from your baseline trigger a specific response. If your cleaning turnaround time spikes on Saturdays, that is a staffing problem. If your ADR drops in a week when your competitors are fully booked, that is a pricing problem. The metric points you to the category; your operational knowledge tells you the fix.
How do operational reporting tools consolidate vacation rental data?
Dashboards integrated with PMS and booking platforms give real-time visibility into occupancy, revenue, cleaning, and maintenance status. This matters because performance analytics update continuously to reflect reservations, expenses, and payments in progress. A static spreadsheet you update on Fridays cannot tell you that a guest checked in two hours ago and your cleaning team has not marked the unit ready.
The table below shows the feature categories that separate basic reporting tools from purpose-built vacation rental analytics platforms:
| Feature | Basic reporting tools | Purpose-built platforms |
|---|---|---|
| Data sources | Manual entry or single PMS | PMS, Airbnb, Vrbo, finance, cleaning apps |
| Update frequency | Daily or weekly batch | Real-time or near real-time |
| Automated alerts | None | Cleaning delays, maintenance flags, review drops |
| Owner reporting | Manual PDF exports | Branded, automated owner reports |
| Benchmarking | None | Market comparisons with similar properties |
| Pricing integration | None | Dynamic pricing signals from booking pace |
Key Data, for example, specializes in market benchmarking data that lets you compare your RevPAR against a competitive set in your market. Roadrunner Escapes publishes detailed guidance on what metrics matter most in a property management dashboard. Neither replaces a full operational reporting setup, but both illustrate what purpose-built tools prioritize over generic analytics software.
Pro Tip: When evaluating any reporting tool, test whether it can send you an automated alert when a cleaning job is not marked complete within 30 minutes of the scheduled start time. If it cannot, you will still be manually chasing your cleaning team on busy turnover days.
Automated alerts are the feature most managers undervalue until they experience a guest arriving at an unready unit. A well-configured dashboard flags that risk before the guest lands at the airport.
Why benchmarking and KPI relationships matter more than raw numbers
High occupancy or ADR alone can be misleading. Interpreting relationships between KPIs and leading indicators enables proactive management. This is the insight that separates managers who react from managers who plan.
Consider this scenario: your occupancy rate is 78% and your ADR is $220. Both numbers look acceptable. But benchmarking KPIs against market competitors reveals that comparable properties in your market are running 88% occupancy at $240 ADR. You are not underperforming in isolation. You are underperforming relative to the opportunity your market is offering. That distinction changes your response entirely.
Leading indicators are the metrics that predict future performance rather than describe past results. The most useful ones for vacation rental managers include:
- Booking pace: How quickly future dates are filling relative to the same period last year. A slow booking pace 60 days out signals a pricing or visibility problem you can still fix.
- Booking window: The average number of days between reservation and check-in. A shrinking booking window often means guests are not finding your property early enough, which points to a listing optimization issue.
- Conversion ratio: The share of listing views that result in bookings. A low conversion ratio with strong traffic means your photos, pricing, or description are losing guests who found you.
Tracking booking pace and conversion ratios provides 60 to 90 days of advance warning to adjust strategy. That window is the difference between a proactive rate adjustment and a last-minute discount that trains guests to wait for deals. Successful managers treat KPIs as tools to read early market signals and act before revenue impact occurs.
The practical takeaway: never review a single metric in isolation. Always ask what the surrounding metrics say about the same time period. Occupancy, ADR, booking pace, and review scores together tell a story that none of them tells alone.
How operational reporting improves daily management decisions
Operational reports are not just for monthly reviews. The most effective property managers build them into daily and weekly workflows. Here is how that looks in practice:
- Daily dashboard check: Review overnight bookings, any maintenance alerts, and cleaning schedules for the day. This takes five minutes and prevents the most common guest-facing failures.
- Weekly pricing review: Compare your booking pace for the next 30 and 60 days against your targets. Adjust rates on underperforming dates before the booking window closes.
- Bi-weekly maintenance audit: Pull your open maintenance tickets and sort by age. Any ticket older than seven days gets escalated. Tracking maintenance resolution prevents booking delays and enhances guest satisfaction.
- Monthly owner report: Generate a branded performance summary for each property owner. Transparent, branded owner reports built from operational data build trust and reduce owner churn. Owners who see clear performance visuals are far less likely to switch management companies.
- Quarterly benchmarking review: Compare your portfolio performance against market data. Identify which properties are outperforming and which need pricing, listing, or operational changes.
This rhythm turns data-driven operations into a repeatable system rather than a one-off analysis. You can explore practical reporting templates to structure these workflows for your own portfolio. The managers who scale beyond 20 properties without losing service quality are almost always the ones who have formalized this rhythm early.
Key takeaways
Operational reporting for vacation rentals works when you track the right metrics, interpret them in relationship to each other, and act on leading indicators before revenue is lost.
| Point | Details |
|---|---|
| Define your KPI set | Track 5 to 10 metrics across revenue, guest experience, operations, and profitability. |
| Use real-time dashboards | Connect your PMS, Airbnb, and Vrbo to a single dashboard for live operational visibility. |
| Read KPI relationships | Never evaluate occupancy, ADR, or review scores in isolation. Cross-reference always. |
| Act on leading indicators | Booking pace and conversion ratios give you 60 to 90 days to adjust strategy proactively. |
| Report transparently to owners | Branded performance reports reduce owner churn and demonstrate management value. |
Why most managers are still leaving money on the table
I have reviewed operational setups for dozens of vacation rental businesses over the years, and the pattern is almost always the same. Managers are not short on data. They are short on organized data. They have a PMS, a channel manager, a cleaning app, and a spreadsheet they update when they remember to. Each tool has its own dashboard. None of them talk to each other. The result is a reporting process that takes hours and still misses the signals that matter.
The bigger mistake I see is treating operational reporting as a reporting task rather than a decision-making tool. Managers pull numbers to satisfy an owner request or prepare for a quarterly review. That is backward. The numbers should be pulling you toward decisions before anyone asks. When your booking pace for next month is 20% behind last year, you should already be adjusting rates. You should not be discovering that gap when the month is over.
I am also skeptical of the instinct to track everything. I have seen dashboards with 40 metrics that paralyze managers instead of guiding them. The discipline is in choosing the 8 metrics that actually drive your business and ignoring the rest. If a metric does not change how you act, it is noise. The role of data in property management is not to generate reports. It is to make the next decision obvious.
One more thing: owner communication is an underrated application of operational data. A well-formatted monthly report that shows an owner their occupancy trend, their NOI, and how their property compares to the market is worth more than any sales conversation. It is proof. Managers who deliver that consistently keep clients longer and get referrals faster.
— Jose
See how Realtevoos handles operational reporting for you

Realtevoos is built specifically for vacation rental property managers who are done assembling reports by hand. The platform pulls live data from Airbnb, Vrbo, and your PMS into a single command center for operators, giving you real-time visibility into occupancy, revenue, cleaning status, and maintenance alerts across your entire portfolio. Automated owner reports go out on your schedule without manual work. AI-driven alerts flag operational issues before guests notice them. If you are managing more than five properties and still spending hours on reporting each week, Realtevoos is the direct fix. See what your operations look like when the data is already organized for you.
FAQ
What is operational reporting for vacation rentals?
Operational reporting for vacation rentals is the practice of tracking and analyzing key performance metrics like occupancy, ADR, cleaning turnaround, and guest review scores to manage properties efficiently and make data-driven decisions.
What metrics should I include in a vacation rental operational report?
Focus on 5 to 10 metrics across four categories: revenue (occupancy, ADR, RevPAR), guest experience (review scores, repeat guest rate), operations (cleaning turnaround, maintenance resolution time), and profitability (NOI, cost per booking).
How often should vacation rental managers review operational reports?
Daily dashboard checks catch same-day issues like cleaning delays, weekly reviews cover pricing and booking pace, and monthly reports serve owner communication and trend analysis.
What is the difference between operational and financial reporting in rentals?
Financial reports show what happened to your revenue and expenses. Operational reports explain why performance moved and which process-level factors like maintenance delays or low conversion ratios are driving the result.
How does benchmarking improve vacation rental performance?
Benchmarking compares your KPIs against similar properties in your market, revealing whether strong-looking metrics actually reflect competitive underperformance. Key Data provides market-level comparison data specifically designed for this purpose.