Portfolio Performance Tracking Workflow for Rental Managers
Discover the essential steps of a portfolio performance tracking workflow. Enhance your rental management by making data-driven decisions today!

Portfolio Performance Tracking Workflow for Rental Managers
A portfolio performance tracking workflow is a structured process that helps vacation rental property managers continuously measure, analyze, and improve their investment portfolio performance. Without it, you are making pricing, reinvestment, and expansion decisions based on gut feel rather than data. The most effective workflows combine unified data consolidation, key metrics like Total Return, Time-Weighted Return (TWR), and Money-Weighted Return (XIRR), and a repeatable review schedule. Property managers who build this process into their operations gain clearer visibility into what is working, where costs are leaking, and which properties deserve more capital.
What are the essential components of a portfolio performance tracking workflow?
A performance measurement workflow starts with one non-negotiable requirement: a single, unified data structure. Every transaction, rental income deposit, platform fee, cleaning cost, and maintenance expense must live in one place. Fragmented dashboards cause errors that compound over time, especially when you manage properties across Airbnb, Vrbo, and direct booking channels simultaneously.
The two main tool categories are spreadsheets and dedicated SaaS platforms. Excel and Google Sheets work well for managers with one to three properties. They are free, flexible, and easy to customize. The problem is that spreadsheets become fragile as your portfolio grows across multiple properties, currencies, and booking platforms.

| Tool Type | Scalability | Data Automation | Best For |
|---|---|---|---|
| Excel / Google Sheets | Low | Manual | 1–3 properties, simple portfolios |
| Dedicated SaaS platforms | High | Automated syncs, imports | 4+ properties, multi-channel operators |
| Integrated property management platforms | Very High | AI-driven, real-time | Multi-property operators needing full operational view |
Data hygiene is the hidden variable that separates accurate reports from misleading ones. You must account for platform fees, currency conversions if you attract international guests, and any owner contributions that are not revenue. Direct CSV imports or broker-style statement uploads provide more reliable data than third-party aggregators, which often miss non-standard asset classes or private equity holdings.
Pro Tip: Set up automated syncs between your booking platforms and your tracking tool from day one. Retrofitting two years of manual data is far more painful than building the habit early.
Which key performance metrics should vacation rental managers track?
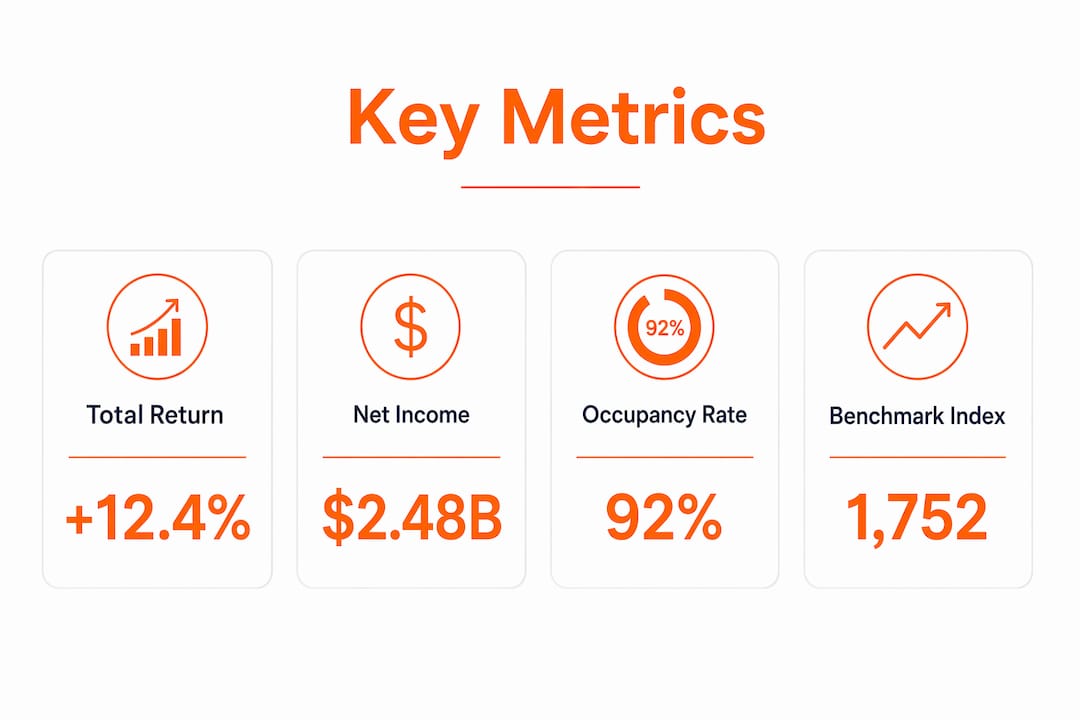
Total Return is the starting point for any investment tracking process. It measures the combined gain from rental income and property value appreciation as a percentage of your initial investment. Total Return tells you whether the portfolio is growing, but it does not tell you how efficiently you are managing it.
That distinction belongs to TWR and XIRR. TWR isolates your management performance from the effect of new capital you add or withdraw. It is the right metric for benchmarking your portfolio against a regional real estate index or a comparable market. XIRR, on the other hand, accounts for the exact timing and size of every cash flow. It answers the personal question: what is my actual annualized return given when I invested each dollar?
Vacation rental managers also need operational metrics alongside financial ones:
- Occupancy rate: The percentage of available nights booked in a given period. Low occupancy on a high-value property is a red flag that pricing or marketing needs adjustment.
- Revenue per available rental (RevPAR): Total rental revenue divided by total available nights. RevPAR captures both pricing power and occupancy in a single number.
- Annualized Return (CAGR): Smooths out year-to-year volatility to show your compound growth rate over time.
- Portfolio beta and concentration risk: Tracking alpha and risk metrics reveals whether your returns come from skill or from simply owning properties in a hot market.
The most common mistake managers make is tracking contributions alongside returns without separating them. Separating new capital from market returns is the only way to know whether your portfolio is genuinely outperforming or just growing because you keep adding money to it.
Pro Tip: Pick one regional short-term rental index or comparable market benchmark and measure your TWR against it every quarter. Without a benchmark, a 12% return sounds great until you realize the market returned 18%.
How to set up a recurring schedule for portfolio performance review
Consistency beats sophistication every time in a performance review schedule. A weekly check that takes five minutes beats a quarterly deep dive you keep postponing. A multi-layered review schedule gives you both frequency and depth without burning hours you do not have.
A proven cadence for vacation rental managers looks like this:
- Weekly (5 minutes): Glance at total portfolio value, current occupancy rates, and any flagged anomalies in your dashboard. The goal is to catch problems early, not to analyze them.
- Monthly (30 minutes): Review revenue trends by property, compare actual RevPAR against your target, and check that all transactions have been recorded correctly. This is where you spot a property that is underperforming before it becomes a bigger issue.
- Quarterly (1–2 hours): Run a full asset allocation review. Assess concentration risk, recalculate TWR and XIRR, and reconcile your records against platform statements from Airbnb and Vrbo. Quarterly is also when you review fee structures and identify any cost increases that have crept in.
- Annual (half day): Conduct a comprehensive audit covering tax implications, capital expenditure planning, and portfolio strategy. This is the session where you decide whether to acquire, divest, or reinvest.
Calendar blocking is the practical key to making this work. Schedule each review as a recurring calendar event and treat it like a guest check-in. You would not cancel that. Automation and scheduled reviews reduce errors and improve your ability to make sound allocation decisions over time.
Delegation matters at scale. If you manage more than five properties, assign the weekly and monthly data entry checks to a team member. Reserve your own time for the quarterly and annual reviews where judgment matters most.
What are common mistakes in portfolio performance tracking workflows?
The most damaging mistake is data fragmentation. Managers who pull revenue from Airbnb, expenses from a spreadsheet, and maintenance costs from email threads end up with three versions of the truth. None of them is accurate. Quarterly spot checks against platform statements that include fees, dividends, and currency adjustments are the standard fix.
A second common failure is confusing TWR and XIRR. Managers who use only one metric get a distorted picture. TWR tells you how well the portfolio performed independent of your cash flow decisions. XIRR tells you what your money actually earned given when you deployed it. You need both.
Other frequent pitfalls include:
- Failing to backfill historical data: Missing dividends, fees, and FX conversions from the initial setup phase create persistent inaccuracies that are hard to trace later.
- Over-relying on spreadsheets at scale: Spreadsheets become fragile when a portfolio spans multiple brokers, currencies, or asset types. The risk of formula errors and version conflicts grows with every new property.
- Tracking P&L without diagnostics: Portfolio tracking is not just P&L monitoring. Its real value is in revealing hidden risks, correlations between properties, and concentration in a single market or property type.
Pro Tip: Build an audit trail from day one. Log every transaction with a date, source, and category. When a number looks wrong six months later, you will be able to trace it in minutes instead of hours.
How can portfolio analytics tools improve operational workflows?
Portfolio analytics tools do more than calculate returns. They identify concentration risk, surface sector overlaps, and flag properties where revenue growth has stalled relative to costs. A manager running ten properties across two markets without analytics is flying blind on which assets are actually pulling their weight.
The most useful operational insight comes from combining financial and occupancy data in one view. When you see that a property has a 78% occupancy rate but below-average RevPAR, the data is telling you that pricing is too low, not that demand is weak. That is a different problem with a different fix.
Key ways analytics tools drive better decisions:
- Revenue optimization: Identify properties where rate increases would not hurt occupancy based on historical demand patterns.
- Cost control: Spot maintenance and cleaning cost trends before they erode margins.
- Expansion planning: Use CAGR and concentration data to decide which markets have room for additional properties.
Realtevoos is built specifically for this kind of centralized rental data management. It pulls real-time data from Airbnb and Vrbo into a single dashboard, automates reporting, and gives multi-property operators a unified view of both financial and operational metrics. For managers who have outgrown spreadsheets, it removes the manual work that makes consistent tracking hard to sustain. You can also explore operational reporting examples to see how structured data translates into clearer decisions.
Key Takeaways
A consistent, multi-layered portfolio performance tracking workflow is the single most reliable way for vacation rental managers to protect margins, identify underperforming assets, and make confident reinvestment decisions.
| Point | Details |
|---|---|
| Unify your data first | Consolidate all transactions, fees, and income into one system before building any reports. |
| Track TWR and XIRR together | TWR benchmarks management skill; XIRR measures personal capital growth. Both are required. |
| Use a layered review schedule | Weekly, monthly, quarterly, and annual reviews each serve a different diagnostic purpose. |
| Audit quarterly without exception | Reconcile platform statements, fees, and FX rates every quarter to prevent compounding errors. |
| Graduate from spreadsheets at scale | Dedicated platforms handle multi-property complexity that spreadsheets cannot sustain reliably. |
Why I think most managers are tracking the wrong things
After working with vacation rental operators across dozens of markets, the pattern I see most often is this: managers track revenue religiously and ignore everything else. They know their monthly gross to the dollar. They have no idea what their annualized return is, what their concentration risk looks like, or whether their best-performing property is actually their most efficient one.
The uncomfortable truth is that a high-revenue property with high maintenance costs and low occupancy efficiency can be a drag on your overall portfolio. You will never see that without a proper performance measurement workflow. The managers who scale successfully are not the ones with the most properties. They are the ones who know exactly which properties deserve more capital and which ones are costing them more than they realize.
My recommendation is to start simple. Pick three metrics: Total Return, occupancy rate, and RevPAR. Track them consistently for 90 days. Then add TWR and XIRR once you have clean data. The tool matters far less than the habit. I have seen managers run tight, accurate portfolios in Google Sheets and I have seen managers with expensive software who still cannot tell you their annualized return. Consistency and data quality are the variables that actually determine whether your workflow produces insight or just noise.
— Jose
Realtevoos: a command center built for multi-property operators
Managing five or more vacation rental properties means your tracking needs go beyond a spreadsheet. You need a system that pulls data from every channel, generates reports automatically, and gives you a real-time view of your entire portfolio without hours of manual work each week.
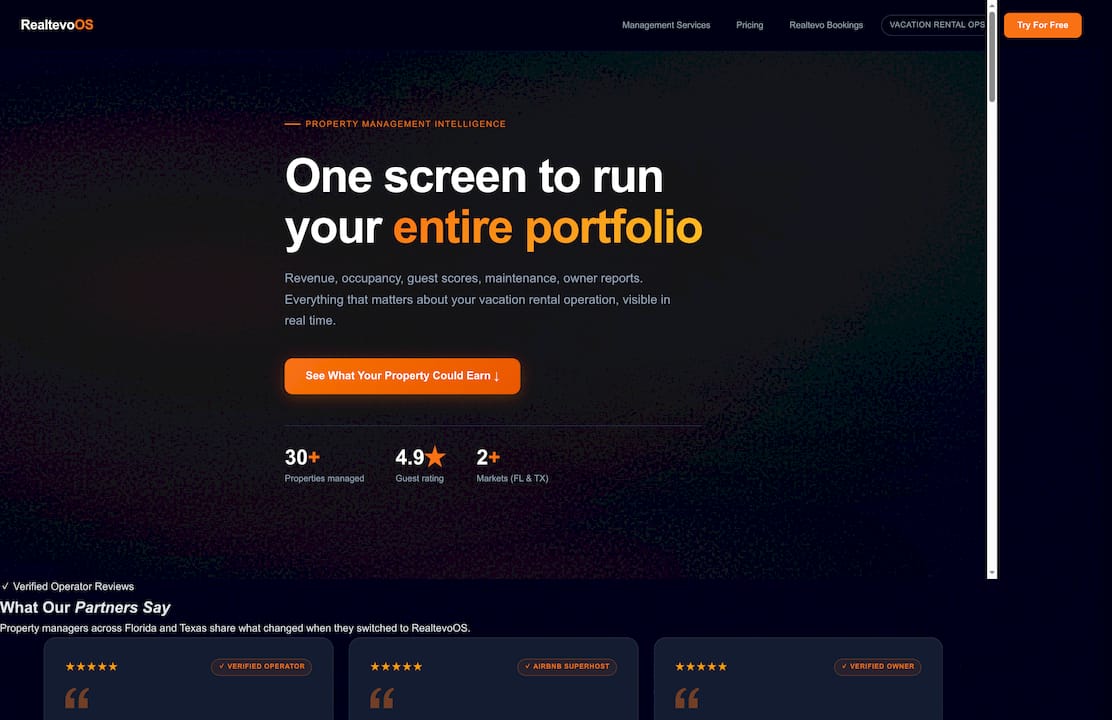
Realtevoos is built for vacation rental operators who need exactly that. It consolidates financial and operational data from Airbnb, Vrbo, and direct booking channels into one dashboard, automates performance reporting, and supports the kind of multi-layered review schedule that keeps portfolios on track. Property managers report saving several hours each week by replacing manual reporting with automated workflows. If you are ready to move beyond fragmented data and build a tracking system that scales with your portfolio, Realtevoos is the place to start.
FAQ
What is a portfolio performance tracking workflow?
A portfolio performance tracking workflow is a structured, repeatable process for measuring, analyzing, and improving the financial and operational performance of a property portfolio. It combines data consolidation, key metrics, and scheduled reviews into a single system.
What is the difference between TWR and XIRR?
TWR measures portfolio performance independent of cash flow timing, making it ideal for benchmarking against market indices. XIRR accounts for the exact timing and size of each cash flow, giving you your true personal annualized return.
How often should vacation rental managers review portfolio performance?
A proven schedule includes a 5-minute weekly value check, a 30-minute monthly trend review, a 1–2 hour quarterly deep dive, and a half-day annual audit. Each layer serves a different diagnostic purpose.
When should I move from spreadsheets to a dedicated platform?
Move to a dedicated platform when your portfolio spans more than three or four properties, multiple booking channels, or requires currency conversion. Spreadsheets become unreliable at that level of complexity.
What metrics matter most for vacation rental portfolio performance?
Total Return, TWR, XIRR, occupancy rate, and RevPAR are the five metrics that give you a complete picture of both financial performance and operational efficiency across your portfolio.