Cross-Property Competitive Analysis Guide for Rental Portfolios
Unlock your rental portfolio’s potential with our cross-property competitive analysis guide. Achieve benchmarks and optimize pricing in just two days!

Cross-Property Competitive Analysis Guide for Rental Portfolios
Run this workflow this week and you’ll have your first set of portfolio benchmarks within two days. The four steps are: segment your listings into comparable groups, benchmark each group against a peer comp set, convert KPI gaps into specific pricing rules, and act by scheduling those rules and ops fixes in your PMS. A small team of two analysts can complete the data pull, segmentation, and initial benchmarking in a single day, with actions scheduled by day two. The workflow produces four deliverables:
- Peer-ranked KPI scorecard for every segment (ADR, occupancy, RevPAR)
- Pricing rule set mapped to each KPI gap
- Ops-priority list ranked by revenue impact
- Owner-facing performance report with comparative context
Pro Tip: Start with portfolio RevPAR (Revenue Per Available Rental). It captures both rate and occupancy in one number, so a single week of movement tells you whether a pricing or demand problem is driving underperformance.
Table of Contents
- What does cross-property competitive analysis actually cover?
- Which KPIs should you benchmark across every property?
- How do you pick comparables across a multi-listing portfolio?
- Where does your data come from, and how do you clean it?
- How often should you run the analysis, and what does it cost?
- How do you turn benchmark gaps into pricing rules and ops fixes?
- What should your portfolio dashboard and reports look like?
- What mistakes will invalidate your benchmark results?
- What does the workflow look like end to end?
- Key Takeaways
- Why portfolio benchmarking is the highest-leverage skill you can build
- Realtevoos puts this workflow on autopilot for your portfolio
- Useful sources and further reading
What does cross-property competitive analysis actually cover?
Portfolio-level benchmarking for vacation rentals, sometimes called cross-property competitive analysis, is the practice of comparing performance metrics across multiple short-term rental listings against a structured peer comp set, then translating those gaps into pricing and operations decisions. It is not a single-property comparative market analysis (CMA) used in home sales, and it is not a general corporate strategy exercise.
Scope of this guide:
- Multi-listing ADR, occupancy, and RevPAR benchmarking across your portfolio
- Comp-set selection and segmentation across listings and markets
- Pricing-rule translation from KPI gaps
- Ops prioritization across units based on performance data
- Multi-market legal and regulatory notes relevant to U.S. property managers
- Data sources: Airbnb, Vrbo, PMS/channel manager, accounting, and ops platforms
This guide does not cover home-sale valuation CMAs, traveler booking tips, or single-property host strategy. Throughout, Airbnb and Vrbo appear as primary data sources, and Realtevoos is the recommended implementation platform.
“Managers should stop comparing to the place next door. Guests compare capacity, photos, reviews, amenities, cancellation policy, and price — not proximity alone. Build your comp set around guest decision factors, and revisit it monthly.” — How to Price Your Vacation Rental
Which KPIs should you benchmark across every property?
Tracking the right revenue KPIs means focusing on a short list that drives decisions, not every metric your PMS exports. Here are the eight you need, with formulas and interpretation:
| KPI | Formula | Data sources | High value means | Low value means |
|---|---|---|---|---|
| ADR | Total rental revenue ÷ nights sold | PMS, Airbnb, Vrbo | Strong rate capture | Underpriced or heavy discounting |
| Occupancy rate | Nights sold ÷ nights available | PMS calendar | High demand or low supply | Weak demand or over-supply |
| RevPAR | ADR × occupancy rate | PMS, channel exports | Balanced rate + fill | Rate or demand problem |
| Length of stay (LOS) | Total nights ÷ number of bookings | PMS | Efficient turnover cost | High cleaning cost per booking |
| Lead time / booking pace | Avg. days from booking to check-in | PMS | Predictable demand | Last-minute dependency |
| Cancellation rate | Cancellations ÷ total bookings | PMS, channel data | Policy too flexible | Normal if <10% |
| Net revenue per booking | Total paid minus fees, refunds, OTA commission | Accounting system | Healthy margin | Fee or refund drag |
| Ops Failure Rate | Failed/incomplete ops tasks ÷ total tasks | Ops/cleaning platform | Ops breakdown risk | Efficient ops |
Sample calculation: A property with $180 ADR and 72% occupancy produces a RevPAR of $129.60. If your comp set averages $145 RevPAR, you have a $15.40 gap to close, either through rate, fill, or both.
Benchmarking KPIs against peer sets reveals relationships between metrics that single-property views miss entirely. A rising ADR paired with falling occupancy, for example, signals a rate ceiling, not a demand problem.
Ops Failure Rate is widely under-tracked. Operational KPIs like Ops Failure Rate and Turnover Time become north-star metrics as portfolios scale past 20 units. Track them with the same rigor you apply to RevPAR.
How do you pick comparables across a multi-listing portfolio?
Comp-set construction is where most portfolio benchmarking breaks down. Follow these steps to build sets that hold up to scrutiny:
- Match on capacity first. A 4-bedroom mountain cabin does not comp against a 1-bedroom beach studio. Start with bedroom count and max-guest capacity as hard filters.
- Apply functional location, not map radius. A property near a ski lift comps against other ski-access units, not every listing within two miles. Define location by guest access to the primary demand driver.
- Filter by visual quality tier. Use Airbnb and Vrbo star-rating bands (4.7+ vs. 4.3–4.6) as a proxy for perceived quality. Mixing tiers distorts ADR benchmarks.
- Require amenity parity. Pool, hot tub, EV charging, and parking are booking-decision factors. A comp set missing these amenities will understate your achievable ADR.
- Check cancellation policy alignment. A strict-policy listing comps differently from a flexible one, especially on lead time and booking pace.
- Target 5–8 comps per segment. Fewer than five creates statistical noise; more than eight dilutes the signal with dissimilar properties. Revisit comp sets monthly as new listings enter your market.
Segmentation checklist for your full portfolio:
- Market and submarket (e.g., Smoky Mountains vs. Gatlinburg downtown)
- Property type (cabin, condo, single-family, townhome)
- Bedroom count and guest capacity
- Guest profile (families, couples, groups)
- Booking-window behavior (advance planners vs. last-minute bookers)
Pro Tip: Separate fast-booking units (average lead time under 14 days) from long-lead units (30+ days) into distinct segments. Blending them produces a meaningless average booking pace and hides two completely different demand patterns.
Where does your data come from, and how do you clean it?
Primary sources to pull from:
- PMS or channel manager exports (nightly rate, fees, occupancy, booking dates)
- Airbnb and Vrbo listing data and calendar availability
- Accounting system (net revenue, refunds, OTA commissions)
- Owner statements (reconciled revenue per property)
- Cleaning and ops platforms (task completion, turnover time)
The portfolio performance tracking workflow on the Realtevo blog walks through pulling and normalizing these fields step by step. For transform logic, the data integration guide covers common field mismatches, including mapping nightly_rate vs. total_paid and reconciling UTC timestamps across markets.
Data-cleaning checklist before any benchmark run:
- De-duplicate listings (same property listed on multiple channels counts once)
- Normalize rate types: separate base nightly rate from cleaning fees and taxes
- Exclude partial-night conversions and test bookings
- Align date ranges and time zones across all exports
- Handle cancellations and refunds consistently (exclude or flag, never mix)
- Confirm sample window: use a rolling 90–180 days with a seasonal control period
One field-level note: platform API rate limits on Airbnb and Vrbo mean bulk pulls may require pagination or scheduled exports rather than real-time queries. Factor that into your data-pull timeline. External signals, including local events, tourism seasonality, and regional economic indicators, add context that raw PMS data cannot provide. Layer these in as annotation flags on your benchmark timeline rather than as hard data fields.
| Data source | Key fields | Common cleaning issue |
|---|---|---|
| PMS export | Nightly rate, fees, occupancy, booking dates | Mixed base/fee rates |
| Airbnb | Calendar availability, review score, listing tier | UTC timezone offset |
| Vrbo | Booking pace, cancellation data | Duplicate cross-listed units |
| Accounting system | Net revenue, OTA commission, refunds | Refund timing mismatches |
| Ops/cleaning platform | Task completion rate, turnover time | Incomplete task logs |
How often should you run the analysis, and what does it cost?
Recommended cadence:
- Daily: Automated alerts for pace drops or occupancy gaps vs. prior week
- Weekly: Pricing check against comp-set ADR and booking pace
- Monthly: Full cross-property benchmark with segment-level KPI comparison
- Quarterly: Strategic portfolio review, comp-set refresh, and market-trend integration
Timeline for a first full run: data pull takes roughly four hours, segmentation another two, benchmarking and gap analysis a half-day, and action-plan documentation another two hours. A team of two covers it in one to two days. Mid-size portfolios with four analysts typically need three to five days when PMS integrations require manual reconciliation. Enterprise portfolios with custom PMS builds and multi-market legal review can run two to four weeks for the initial setup.
Dynamic pricing combined with a calibrated base rate reduces manual workload as portfolios grow. The automation tipping point arrives around five to ten properties, where manual rate adjustments stop scaling without margin loss.
Cost ranges (rough estimates):
- Small DIY (1–10 units, spreadsheets): internal analyst time, roughly 8–16 hours per month
- Mid-range SaaS subscription: purpose-built portfolio analytics tools, typically $200–$800/month depending on unit count
- Enterprise integration: custom PMS connectors and BI pipelines, often $5,000–$20,000 for initial build
Pro Tip: Assign clear role ownership before your first run: one analyst owns data pull and cleaning, a revenue manager owns pricing rules, and an ops lead owns the maintenance and cleaning priority list. Without role clarity, benchmark outputs sit in a shared folder and nothing gets acted on.
How do you turn benchmark gaps into pricing rules and ops fixes?
Gaps only matter when they produce a specific action. Here is a rule-mapping framework:
- RevPAR < market by more than 10%: Raise base rate by 10%, tighten cancellation policy to moderate, and add a two-night minimum on peak weekends.
- Occupancy below segment average with ADR at market: Introduce a 5–7% last-minute discount window (0–14 days out) and relax minimum-stay on shoulder nights.
- Lead time shorter than comp-set average: Add early-bird pricing incentives for bookings 45+ days out to shift demand forward.
- Ops Failure Rate above 5%: Pause rate increases on affected units until cleaning and maintenance backlogs clear. Revenue gains from higher rates evaporate when guest reviews drop.
- Cancellation rate above 12%: Review cancellation policy tier and consider requiring payment at booking rather than at check-in.
Before/after example: A 12-unit mountain cabin segment showed RevPAR of $118 against a comp-set average of $141. Applying rule 1 (base rate +10%) and rule 3 (early-bird incentive) over 60 days moved RevPAR to $136, closing 80% of the gap. The remaining gap traced to two units with Ops Failure Rates above 8%, which suppressed review scores and booking pace.
Ops vs. pricing priority checklist:
- Fix ops failures (cleaning, maintenance, photo compliance) before raising rates
- Address review-score gaps before adding premium amenity fees
- Confirm pricing rules are applied consistently across all channels (Airbnb, Vrbo, direct)
- Log every rule change with a timestamp and rationale for owner reporting
For owner communication, present comparative KPIs side by side with market averages. An owner who sees their property at $118 RevPAR vs. a $141 market average understands the action plan without needing a revenue management degree. Adding concierge-tier guest experience offerings, such as those outlined in this property manager’s concierge guide, can also lift ADR and review scores in parallel with pricing adjustments.
What should your portfolio dashboard and reports look like?
Essential dashboard tiles:
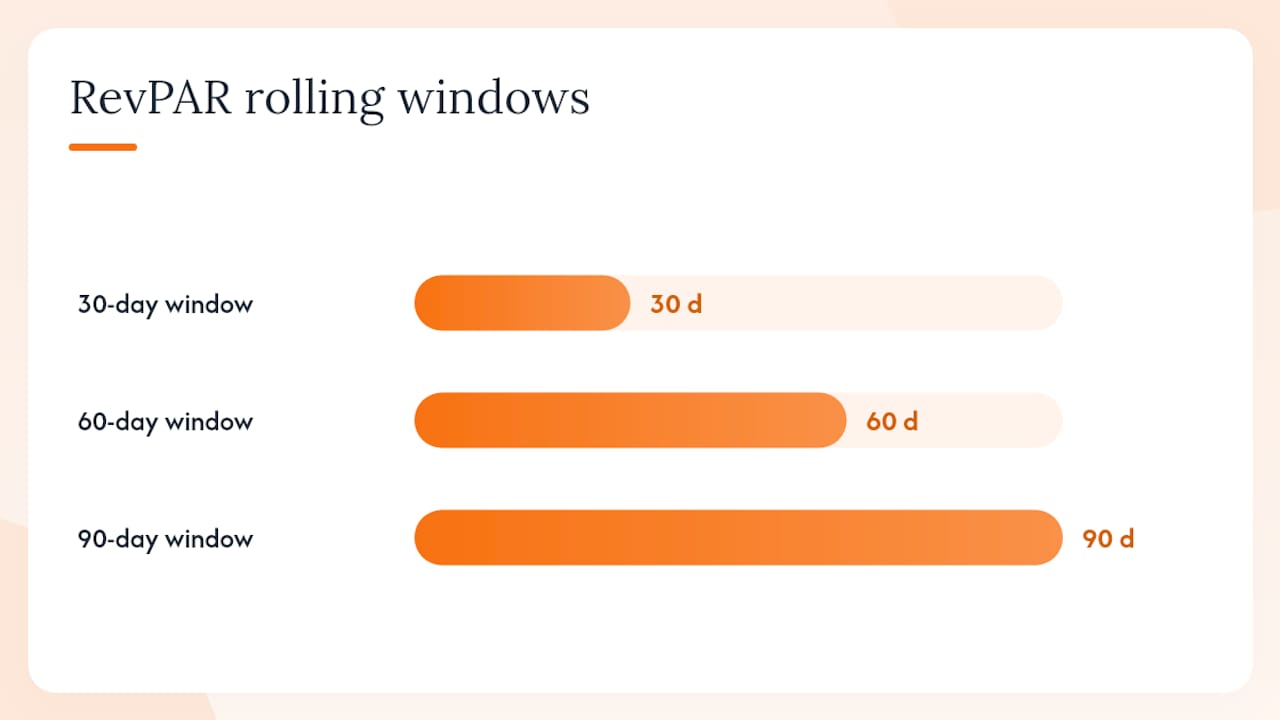
- Portfolio RevPAR trend (rolling 30/60/90 days vs. prior year)
- Segment performance heatmap (color-coded by RevPAR vs. comp set)
- Top 5 underperforming units by RevPAR gap
- Booking pace vs. market (current vs. same period last year)
- Occupancy curve by segment and market
- Ops Failure Rate tracker by unit and team
Report template structure:
| Section | Audience | Content |
|---|---|---|
| Executive snapshot | Leadership | Portfolio RevPAR, ADR, occupancy vs. prior period |
| Segment performance table | Revenue manager | KPI by segment vs. comp set, gap flagged |
| Recommended actions | Ops + revenue | Ranked list of pricing and ops fixes |
| Owner-facing summary | Property owners | Their unit vs. market, actions taken, next steps |
| Data appendix | Analysts | Raw export, cleaning log, comp-set list |
Export formats: PDF for owner reports (scheduled monthly), CSV for analyst review, and API endpoints or webhook outputs for BI tools like Tableau or Power BI. Report template examples on the Realtevo blog show how to structure these for different audience types.
What mistakes will invalidate your benchmark results?
Red flags to catch before trusting any output:
- Mixing guest segments (families vs. bachelor groups) in the same comp set
- Duplicate listings from the same property on Airbnb and Vrbo counted twice
- Unresolved partial refunds inflating net revenue figures
- Sample sizes below five comps per segment
- Failure to control for major local events (festivals, sports, holidays) that spike or suppress demand
Quick audit checklist:
- Confirm date range covers a full 90-day minimum with no gaps
- Verify comp-set size is 5–8 per segment
- Run an outlier check: flag any unit with ADR more than 40% above or below segment mean
- Confirm cancellations are excluded or consistently flagged, not mixed
- Check that all listings are de-duplicated across channels
Remediation steps: For duplicate listings, assign a canonical property ID and merge records before any aggregation. For event spikes, add a binary event flag to your date dimension and filter it out of baseline benchmarks. For small sample sizes, widen the geographic or amenity filter by one tier rather than reporting on insufficient data.
What does the workflow look like end to end?
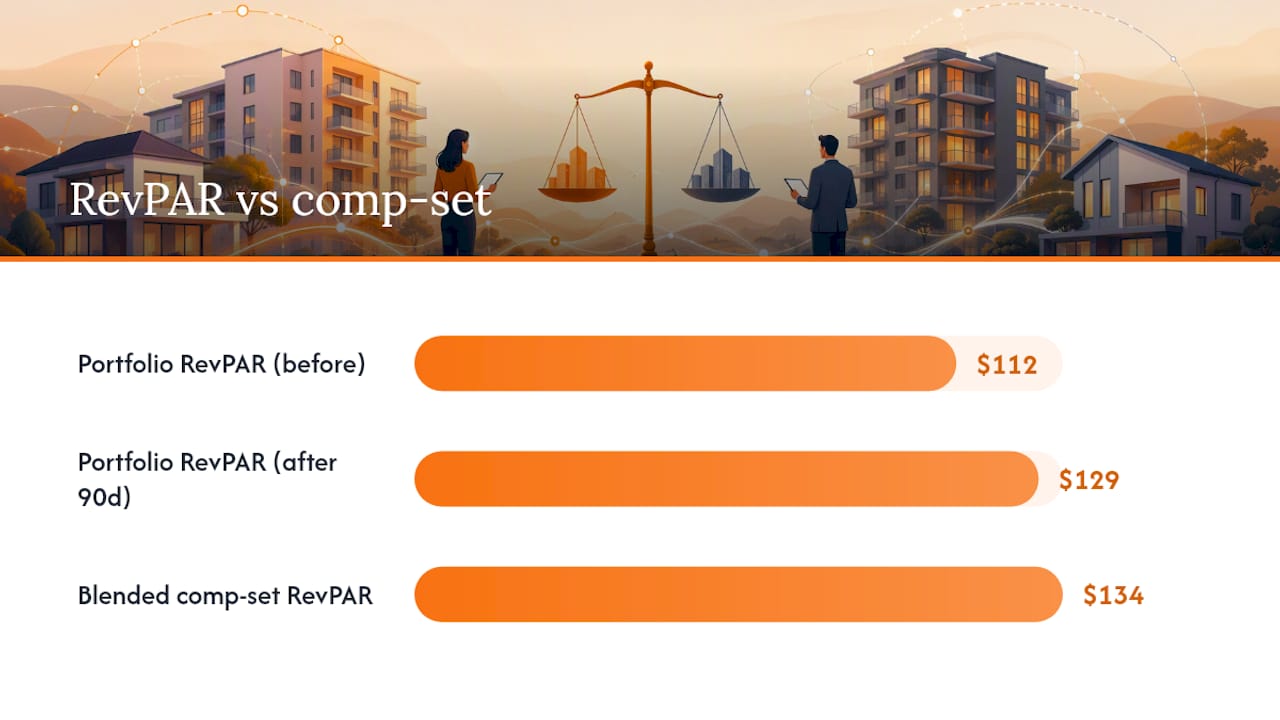
A 28-unit portfolio spanning two U.S. markets (Gulf Coast beach and Tennessee mountains) ran this workflow for the first time over three days. Before the analysis, portfolio RevPAR sat at $112 against a blended comp-set average of $134. Ops Failure Rate averaged 9% across the mountain segment.
What the team did:
- Created four segments: Gulf Coast 2BR, Gulf Coast 4BR, Mountain 2BR, Mountain 4BR
- Built comp sets of 6–7 listings per segment using Airbnb and Vrbo data
- Applied pricing rules: base rate increases on two Gulf Coast segments, early-bird incentives on mountain units, and a two-night minimum on peak mountain weekends
- Prioritized ops fixes on the six mountain units with the highest Ops Failure Rates
Results after 90 days:
- Portfolio RevPAR moved from $112 to $129, a 15% improvement
- Mountain segment Ops Failure Rate dropped from 9% to 4%
- Weekly operations reporting time fell by roughly six hours as the team shifted from ad hoc data pulls to a structured dashboard
The single largest RevPAR gain came from ops fixes, not rate increases. Cleaning the Ops Failure Rate on underperforming mountain units restored review scores, which lifted booking pace and allowed rate increases to hold.
Key Takeaways
Portfolio RevPAR is the single metric that tells you whether your cross-property competitive analysis is working, and the workflow that moves it is repeatable in under two days.
| Point | Details |
|---|---|
| Start with four steps | Segment, benchmark, convert, and act — complete the first run in one to two days with two analysts. |
| Use 5–8 comps per segment | Match on capacity, location function, amenity parity, and review score band; revisit monthly. |
| Fix ops before raising rates | An Ops Failure Rate above 5% suppresses reviews and erases rate gains; prioritize ops fixes first. |
| Run on a tiered cadence | Daily alerts, weekly pricing checks, monthly benchmarks, and quarterly strategic reviews keep data current. |
| Realtevoos automates the workflow | Realtevoos consolidates PMS integrations, dynamic pricing rules, ops scorecards, and owner reporting in one platform. |
Why portfolio benchmarking is the highest-leverage skill you can build
Most property managers track KPIs. Far fewer benchmark them against a structured peer set and then act on the gap with a specific rule. That gap between tracking and acting is where portfolio revenue is lost, often quietly, over months of underpriced weekends and unresolved ops failures.
The managers who close that gap fastest share one habit: they treat benchmarking as a scheduled operational process, not a quarterly fire drill. A monthly cross-property benchmark run, even a rough one, surfaces pricing opportunities and ops problems weeks before they show up in owner complaints or review scores. The first run is always the hardest. After that, the data is there, the comp sets are built, and the workflow takes a fraction of the time.
If you manage more than five properties and you are still setting rates manually without a structured comp set, start the first benchmark this week. Measure portfolio RevPAR before and after 90 days. The number will tell you everything you need to know about whether the process is worth continuing.
Realtevoos puts this workflow on autopilot for your portfolio
Running a cross-property benchmark manually works for a first pass. Doing it every month across 20, 50, or 100 units is a different problem. That is where Realtevoos closes the gap between knowing what to do and actually doing it at scale.

Realtevoos integrates directly with Airbnb, Vrbo, Guesty, Hostaway, and your accounting system, pulling normalized data into a single portfolio dashboard without manual exports. The dynamic pricing rule engine maps KPI gaps to rate adjustments automatically, applying floors, ceilings, and minimum-stay rules across every listing simultaneously. Ops scorecards track Ops Failure Rate and Turnover Time by unit, and owner reports generate on a scheduled cadence with comparative market context already included. Property managers using Realtevoos report saving several hours of manual reporting work each week, time that goes back into growing the portfolio rather than maintaining spreadsheets.
Start your portfolio benchmark with Realtevoos and see your first cross-property KPI comparison within your first session.
Useful sources and further reading
Build your 90–180 day benchmarking plan using these sources:
- How to Price Your Vacation Rental
- What’s the best vacation rental pricing strategy?
- Beyond the Basics: How Elite Property Managers Use Vacation Rental KPIs | Key Data
- Most Important Vacation Rental KPIs to Track for Property Managers | Key Data
- Vacation Rental Operational KPIs: The Ops Scorecard for 100+ Unit Portfolios | RapidEye
- RealtevoOS - The Command Center for Vacation Rental Operators
- Portfolio Performance Tracking Workflow for Rental Managers — Realtevo Blog
- Data Integration in Rental Management: 2026 Guide — Realtevo Blog
For external market data, PMS exports combined with Airbnb and Vrbo market reports give you the baseline. Validate any third-party vendor claims against your own PMS data before acting on them. Schedule a 90-day benchmark review at the end of your first run to confirm whether your comp sets, pricing rules, and ops priorities are producing the RevPAR movement the workflow predicts.
This article provides general operational guidance for vacation rental property managers. Regulatory requirements, platform policies, and market conditions vary by jurisdiction. Confirm current rules with the relevant platform documentation or a qualified professional before implementing changes.