Rental Operations Analytics: A 2026 Guide for Managers
Discover what rental operations analytics is and how it can optimize your vacation rental management for better profits and efficiency.

Rental Operations Analytics: A 2026 Guide for Managers
Rental operations analytics is defined as the practice of turning raw property data into clear, actionable insights that help vacation rental managers optimize performance and make faster decisions. The industry term for this discipline is operating intelligence, and it covers everything from net operating income (NOI) and occupancy rates to maintenance costs and guest satisfaction scores. Platforms like Fairview, Property Gauge, and Point of Rental’s Rental Intelligence Suite have made this approach accessible to managers who previously relied on quarterly spreadsheets. If you manage multiple properties on Airbnb or Vrbo, understanding what is rental operations analytics is the single most direct path to running a tighter, more profitable operation.
What is rental operations analytics and how does it work?
Rental operations analytics is the process of collecting, integrating, and analyzing data from your properties to surface patterns you cannot see in a spreadsheet. It connects to your existing property management system (PMS) and normalizes key metrics like NOI, cap rate, occupancy, and operating expense ratios into a single, continuous view. Modern operating intelligence platforms integrate with PMS tools like Yardi, AppFolio, and Entrata without disrupting your current workflows.
The core shift here is from reactive to proactive. Instead of reviewing last quarter’s numbers and guessing what went wrong, you see a live dashboard that flags problems as they develop. A property with rising maintenance costs and falling occupancy shows up in red before it drains your margin. That early signal is the entire value proposition of analytics in property management.

Operating intelligence acts as a decision layer that highlights which assets are performing and which are leaking margin, cutting the feedback delay that quarterly reports create. For a vacation rental manager running 10 or more properties, that speed matters enormously.
Pro Tip: Start with one dashboard metric that directly affects your bottom line, such as NOI per property, before adding more data streams. Clarity beats complexity every time.
What metrics and data sources drive rental analytics?
The metrics that matter most in rental operations analytics fall into three categories: financial performance, operational efficiency, and guest experience. Each category draws from a different data source, and the power of analytics comes from connecting all three.
Here is how the most important data sources map to the metrics they influence:
| Data source | Key metrics influenced |
|---|---|
| Property management system (PMS) | Occupancy rate, revenue per available night, lease performance |
| Accounting software | NOI, cap rate, operating expense ratio |
| Maintenance logs | Repair costs, downtime, asset lifecycle |
| Guest communication tools | Satisfaction scores, response time, review ratings |
| Market comparables | Competitive pricing, demand trends, seasonal benchmarks |
Operating intelligence aggregates data from PMS, lease management, accounting, insurance, and utility billing systems, updated continuously for portfolio-wide visibility. That continuous update cycle is what separates modern rental analytics tools from a monthly export into Excel.
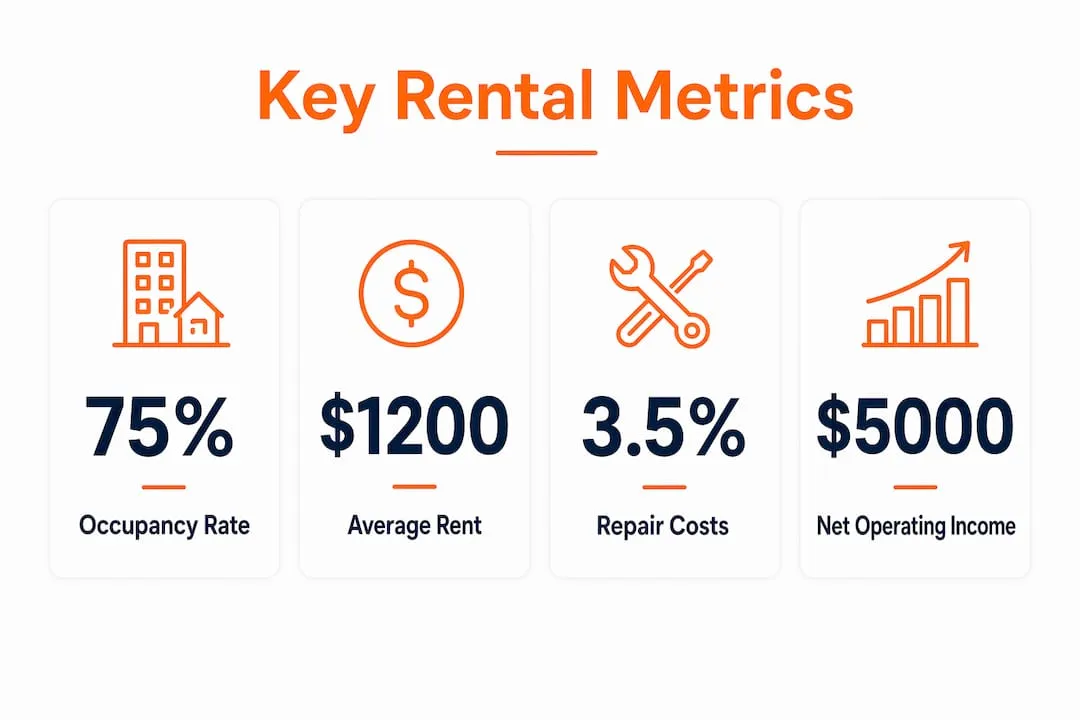
Standardization is the hidden challenge. Two properties using different maintenance log formats produce data that cannot be compared directly. A unified data schema solves this by applying consistent definitions across all assets. Property Gauge addresses this with color-coded standards comparisons and proactive alerts that align teams around the same benchmarks without requiring staff to change their daily tools.
The metrics that most directly affect your decisions are NOI, occupancy rate, and repair cost per unit. Track those three consistently before adding cap rate analysis or tenant satisfaction scoring to your workflow.
What are the benefits of rental analytics for property owners?
The benefits of rental analytics concentrate in four areas: revenue, cost control, portfolio visibility, and guest experience. Each one compounds the others when you act on the data consistently.
- Dynamic pricing precision. Analytics platforms analyze demand patterns, local events, and competitor rates to recommend nightly price adjustments. This approach to vacation rental revenue consistently outperforms static pricing because it responds to real market signals rather than gut instinct.
- Predictive maintenance savings. Predictive maintenance algorithms reduce downtime and costs by scheduling repairs during low-demand periods based on data patterns. A broken HVAC unit discovered mid-summer checkout costs far more than one flagged by a usage trend in April.
- Portfolio gap identification. Analytics give you a ranked view of every property by performance. You can see immediately which asset is underperforming relative to its market and investigate whether the cause is pricing, condition, or management.
- Guest satisfaction tracking. Connecting review data and communication response times to occupancy trends shows you exactly how service quality affects bookings. Properties with faster response times and higher review scores consistently book at higher rates.
Pro Tip: Focus your first 90 days on decision-led metrics that directly affect NOI and guest satisfaction. The rental industry lacks clarity more than it lacks data, so prioritize consistency over complexity.
Data-driven rental management also reduces the cognitive load on your team. When every decision has a number behind it, you spend less time debating and more time acting.
How do you implement rental operations analytics successfully?
Most failed analytics projects share one cause: managers try to build the system from scratch or patch together fragmented spreadsheets. Building analytics from scratch creates inconsistencies that undermine trust in the data and slow adoption across your team.
A proven implementation follows this sequence:
- Connect your existing PMS first. Link your current tools via a managed data layer that normalizes data across systems. This preserves your team’s familiar workflows while creating a clean, unified data feed.
- Build baseline dashboards in the first two weeks. Focus on the three to five metrics that most directly affect your NOI. Avoid building 20 dashboards on day one.
- Train your team on role-specific views. A maintenance coordinator needs different data than a revenue manager. Role-specific dashboards reduce noise and increase daily use.
- Establish a review cadence. Weekly dashboard reviews replace monthly report meetings. The goal is to catch issues in days, not weeks.
- Expand incrementally. Add new data sources and metrics only after your team is consistently acting on the baseline set.
A standard implementation timeline runs approximately 28 days: 10 days for data integration, 5 days for baseline dashboards, and 13 days for training and roadmap development. That timeline is realistic for most vacation rental operations with 5 or more properties.
The most common mistake after launch is data overload. Managers add too many metrics too quickly and the team stops trusting the dashboard. Stick to normalized, role-specific insights and expand only when your team asks for more.
How is AI changing the future of rental operations?
The shift from reactive reporting to AI-enabled proactive intelligence is the defining trend in rental operations right now. AI does not just report what happened. It tells you what to do next.
Here is where AI is delivering the clearest results in rental operations analytics today:
- Natural language queries. Rental Intelligence Suite uses natural language AI so managers can ask plain-language questions like “Which properties had the highest repair costs last month?” and get an immediate, formatted answer. This eliminates the need for a data analyst on staff.
- Automated asset lifecycle decisions. AI models track equipment age, usage frequency, and repair history to recommend replacement before failure. This is especially valuable for vacation rentals where a broken appliance directly affects guest reviews.
- Dynamic pricing adjustments. Machine learning models adjust nightly rates based on demand signals, competitor pricing, and historical booking patterns. The system updates recommendations nightly without manual input.
- Seasonal trend detection. AI identifies revenue shifts and demand patterns weeks before they appear in your booking calendar, giving you time to adjust pricing, staffing, and maintenance schedules.
AI-driven rental analytics leverage machine learning and natural language processing to automate queries, produce customized dashboards, and recommend decisions based on aggregated industry data. The practical result is that a manager running 20 properties can operate with the analytical depth previously available only to large institutional landlords. For more on where this technology is heading, the AI trends in property management picture for 2026 is worth understanding before you choose a platform.
Key Takeaways
Rental operations analytics works because it replaces fragmented, delayed reporting with continuous, normalized data that drives faster and more profitable decisions across your entire portfolio.
| Point | Details |
|---|---|
| Start with operating intelligence | Connect your PMS to a managed data layer before building any dashboards. |
| Prioritize three core metrics | NOI, occupancy rate, and repair cost per unit deliver the clearest early signals. |
| Follow the 28-day implementation cycle | Allocate 10 days for integration, 5 for dashboards, and 13 for training. |
| Use AI for proactive decisions | Natural language tools like Rental Intelligence Suite eliminate manual spreadsheet work. |
| Avoid data overload | Role-specific dashboards increase daily use and prevent team disengagement. |
Why most managers are still one step behind the data
I have watched property managers invest in analytics platforms and still make decisions based on gut instinct three months later. The platform is not the problem. The habit is.
The managers who get the most out of rental operations analytics are the ones who treat their dashboard like a morning briefing, not a monthly report. They check NOI trends before they check their email. They flag a maintenance cost spike the same week it appears, not the same quarter. That discipline is what separates a manager who uses data from one who is managed by it.
The other thing I have seen consistently: the teams that succeed with analytics in property management do not start with the most sophisticated tools. They start with the clearest definitions. What counts as a maintenance cost? How do you calculate occupancy for a property that was offline for renovation? Getting those definitions right across your portfolio matters more than which platform you choose.
My honest advice is to resist the pressure to build a complex model in year one. The operational efficiency gains come from consistent, simple metrics applied across every property, not from a 40-metric dashboard that nobody checks. Start narrow, build trust in the data, and expand from there. The managers who do this outperform the ones chasing the most feature-rich platform every time.
— Jose
See how Realtevoos puts this into practice
Realtevoos is built specifically for vacation rental managers who want the benefits of operating intelligence without the complexity of enterprise software.

The platform connects directly to Airbnb and Vrbo, normalizes your performance data across every property, and delivers role-specific dashboards that your team will actually use daily. AI-driven automation handles guest communications and flags operational issues before they affect your reviews or your revenue. Property managers using Realtevoos report saving several hours each week on manual reporting alone. If you are ready to move from spreadsheets to a real-time vacation rental command center, Realtevoos is the place to start.
FAQ
What is rental operations analytics in simple terms?
Rental operations analytics is the process of collecting data from your properties and turning it into clear insights about performance, costs, and guest satisfaction. It replaces manual spreadsheets with continuous, automated reporting connected to your existing property management tools.
What metrics should vacation rental managers track first?
Start with net operating income (NOI), occupancy rate, and repair cost per unit. These three metrics directly affect profitability and give you a reliable baseline before adding more complex data streams.
How long does it take to implement a rental analytics platform?
A standard implementation runs approximately 28 days, covering data integration, baseline dashboard setup, and team training. Most vacation rental operations with five or more properties can complete this cycle within a single month.
What is the difference between operating intelligence and standard reporting?
Standard reporting shows you what happened in the past, typically on a monthly or quarterly basis. Operating intelligence provides a continuous, real-time view of portfolio health and flags issues as they develop, enabling proactive rather than reactive decisions.
Do rental analytics tools require replacing my current property management system?
No. Platforms like Property Gauge and Fairview connect to your existing PMS via a managed data layer, normalizing data without requiring you to change your current tools or staff workflows.